The Deepest Cricket Intelligence Ever Built.
Not a prediction tool. A decision machine. 200+ data points per match. Multiple categorised analytical segments. Built for every major cricket event across the global calendar — T20 World Cups, franchise leagues. Every number curated. Every pattern connected. Every insight ready the moment you need it. Cricket intelligence. Instant. Absolute.
00
Ball Records
00
Cricket Seasons
00
Analytics Modules
00+
Metrics Per Match
00s
vs 53 min Manual
Why Nothing Else Comes Close
Four Advantages That are Not Easy to Replicate
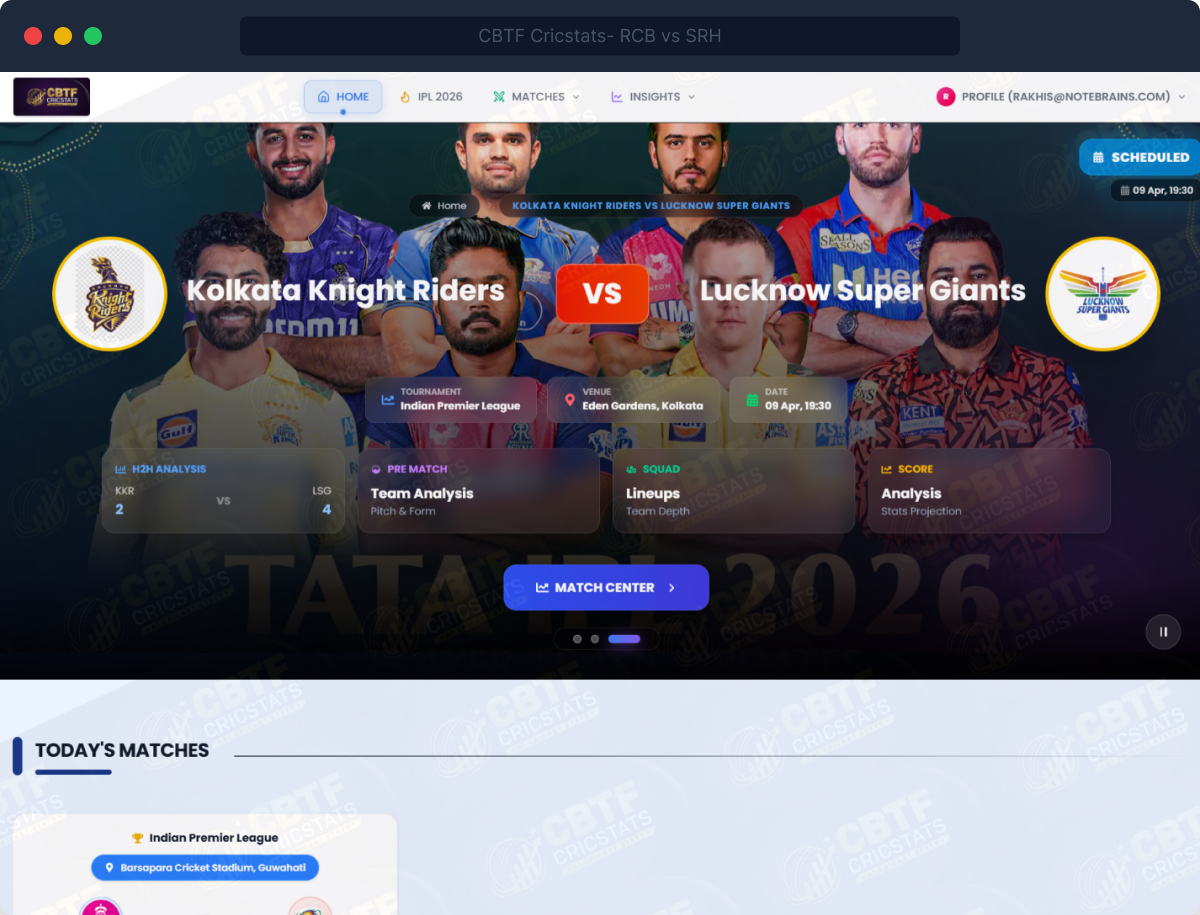
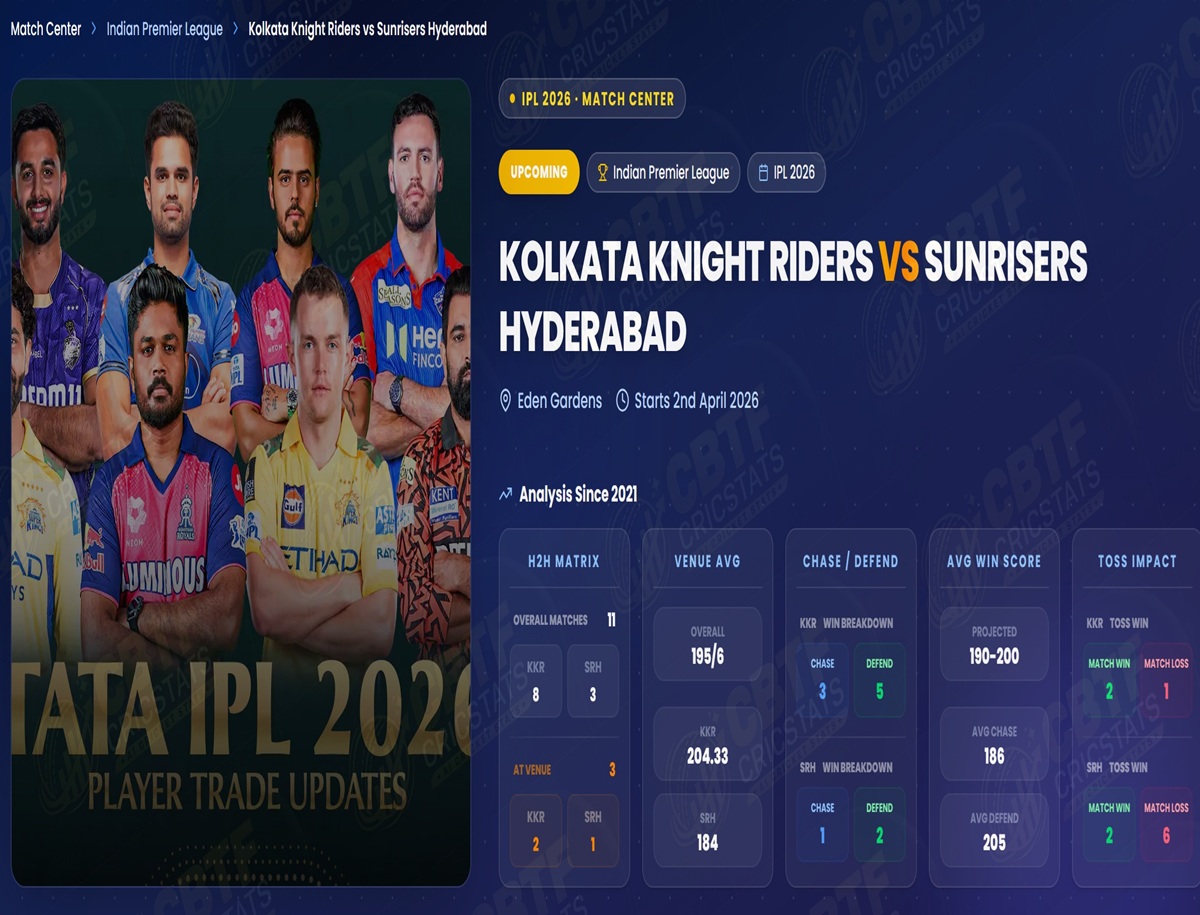
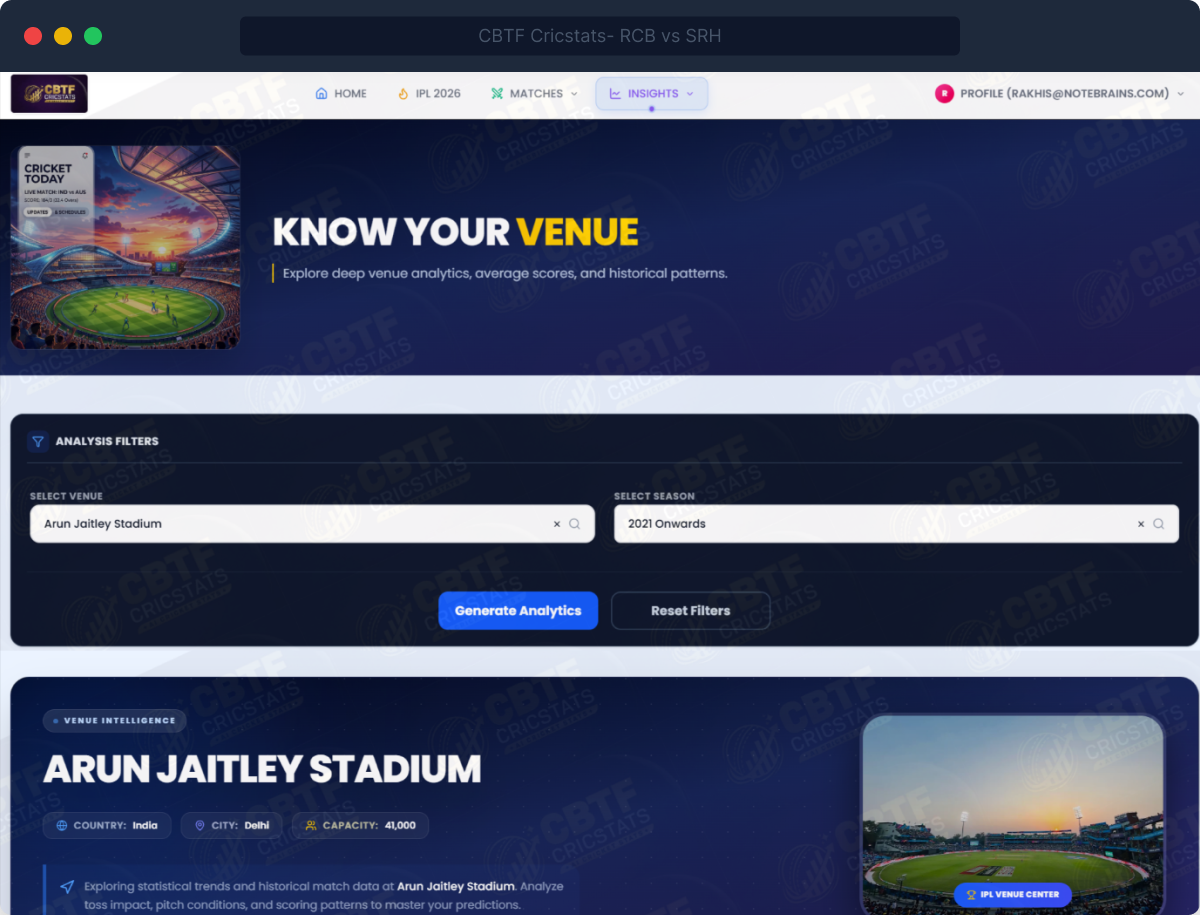
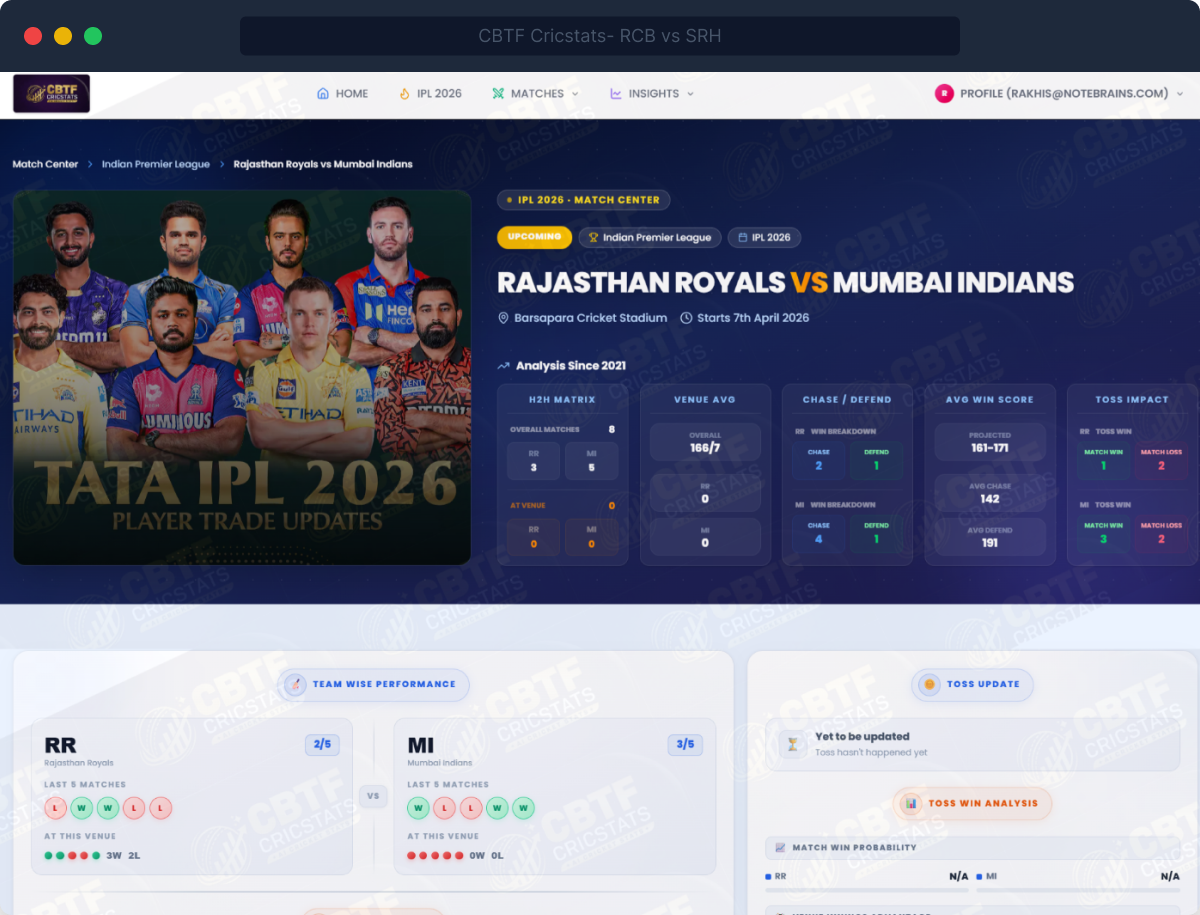
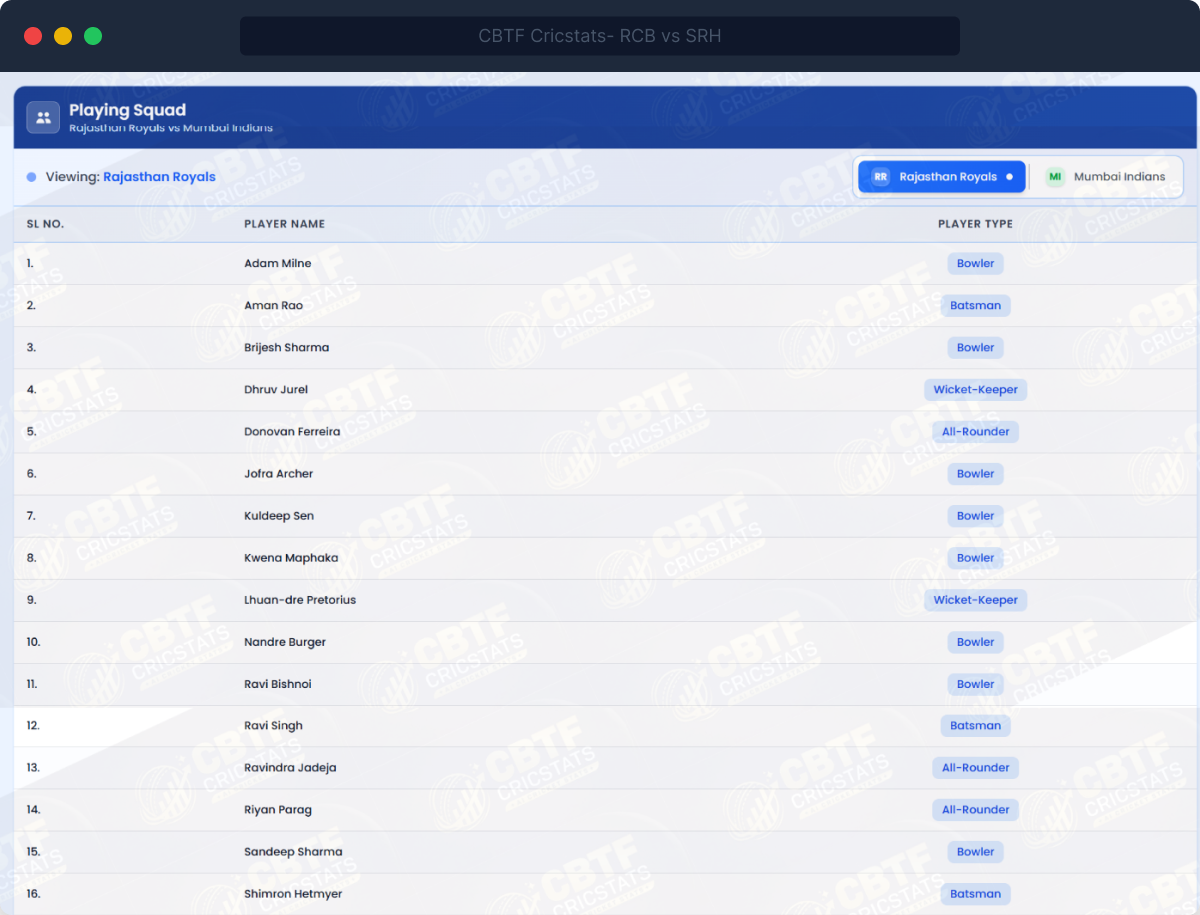
Module 01 · Match Center
Your Complete Pre-Match Brief. In One Screen.
The moment you open a match on CBTF CricStats, years of analytical history loads instantly — condensed into a clean, scannable intelligence brief. H2H records, venue averages, chase vs defend tendencies, toss patterns, and projected score ranges. All in one place, before a ball is bowled.
- H2H matrix — overall record plus venue-specific record between the two teams
- Venue batting average — overall and team-specific scoring benchmarks
- Chase vs defend breakdown — which team wins how, and at what scores
- Projected score range and average win score for this fixture
- Toss impact correlation — does winning the toss meaningfully help here?
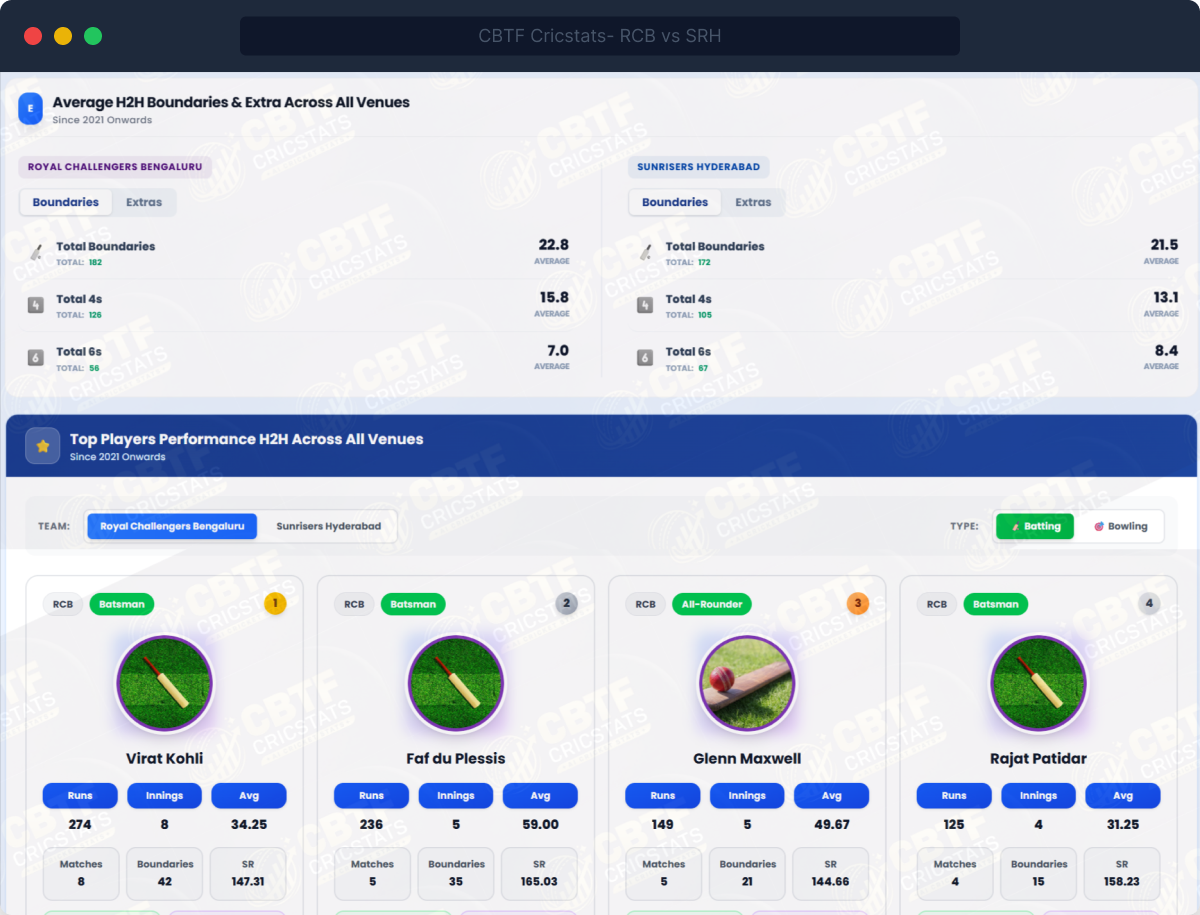
- Player batting cards — runs, average, SR, boundaries for both XIs in H2H
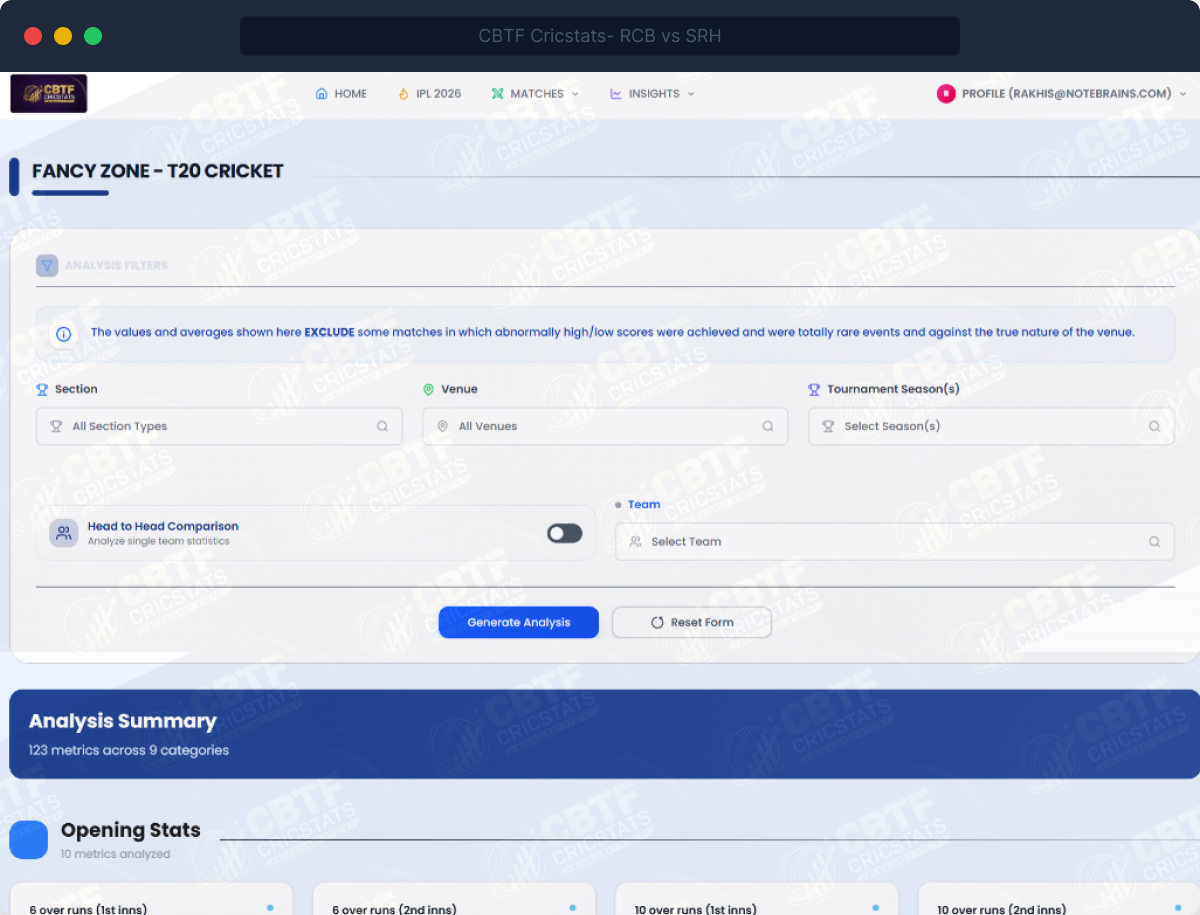
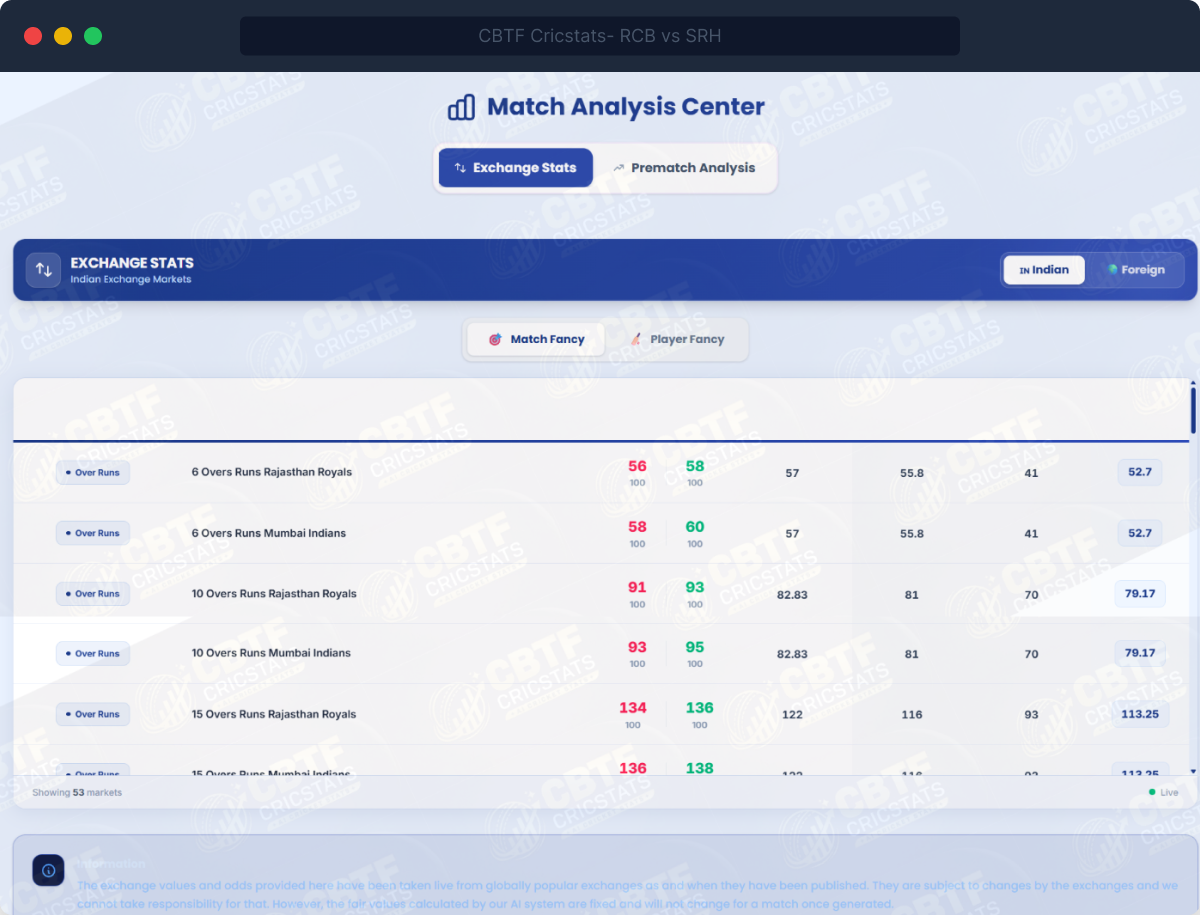
Module 02 · Venue Market Stats
200+ Venue Metrics. Every Stat Has a Floor and a Ceiling.
This is the most comprehensive and actionable venue intelligence system in cricket. Seven stat categories — Opening Stats, Fall of Wickets, Partnerships, Match Totals, Player Counts, Batting Distributions, and Others — each broken down across matches with average, minimum, and maximum values.
The min/max range is what makes this uniquely powerful. Knowing the 6-over average is 49 is useful. Knowing it has ranged from 28 to 71 tells you where today’s score sits on the spectrum of everything that has happened here.
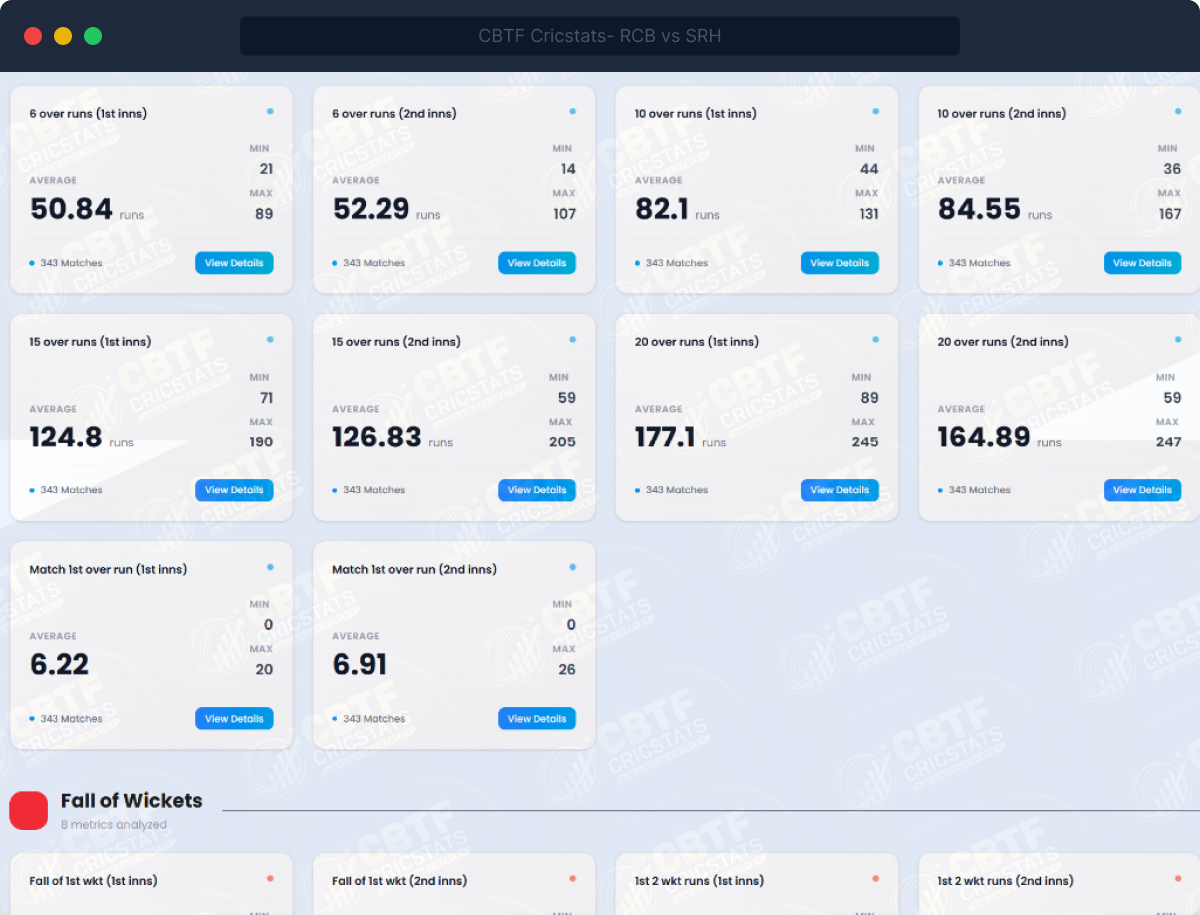
- Inngs Phase Stats: Inngs Phase Avg Runs for both innings with full range
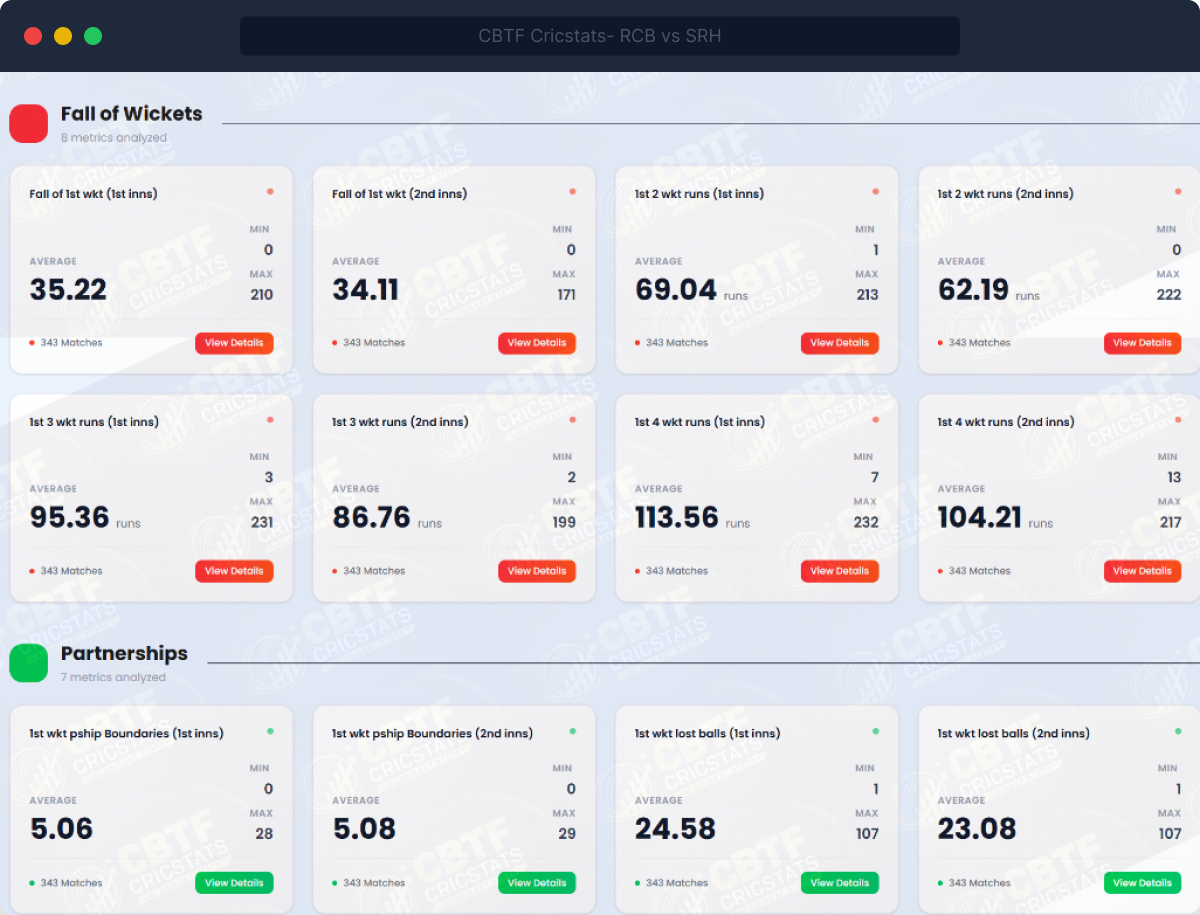
- Fall of Wickets: when the 1st wicket falls, runs at 2-wicket stage
- Match Totals: total runs, wickets, fours, sixes per match and per innings
- Player Counts: how many four-hitters, six-hitters, wicket-takers per match typically
- Batting Distributions: players facing 25+ and 50+ balls, total 30s scored
- Drill-down: every stat linked to a full match-by-match breakdown table
- Time Range: every stats filterable by venue, teams, seasons and a lot more
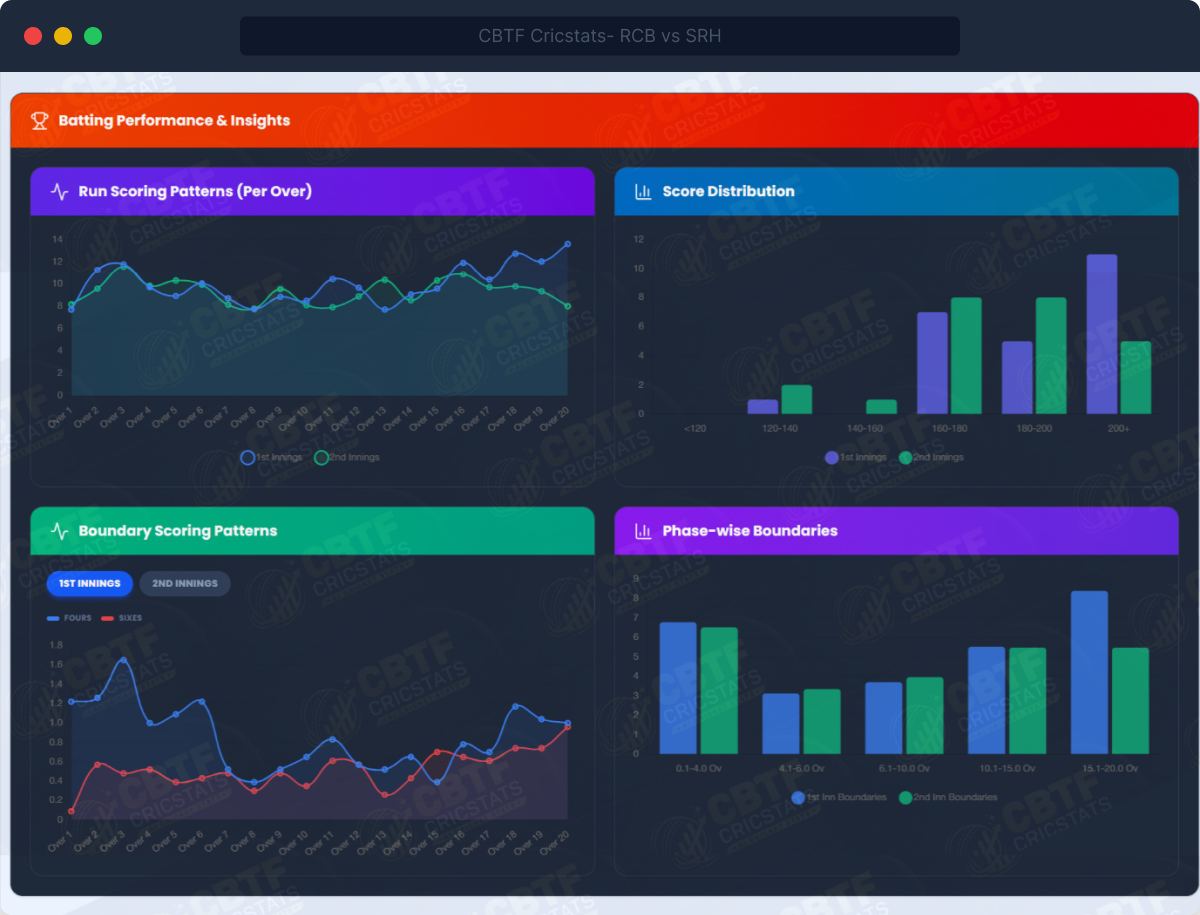
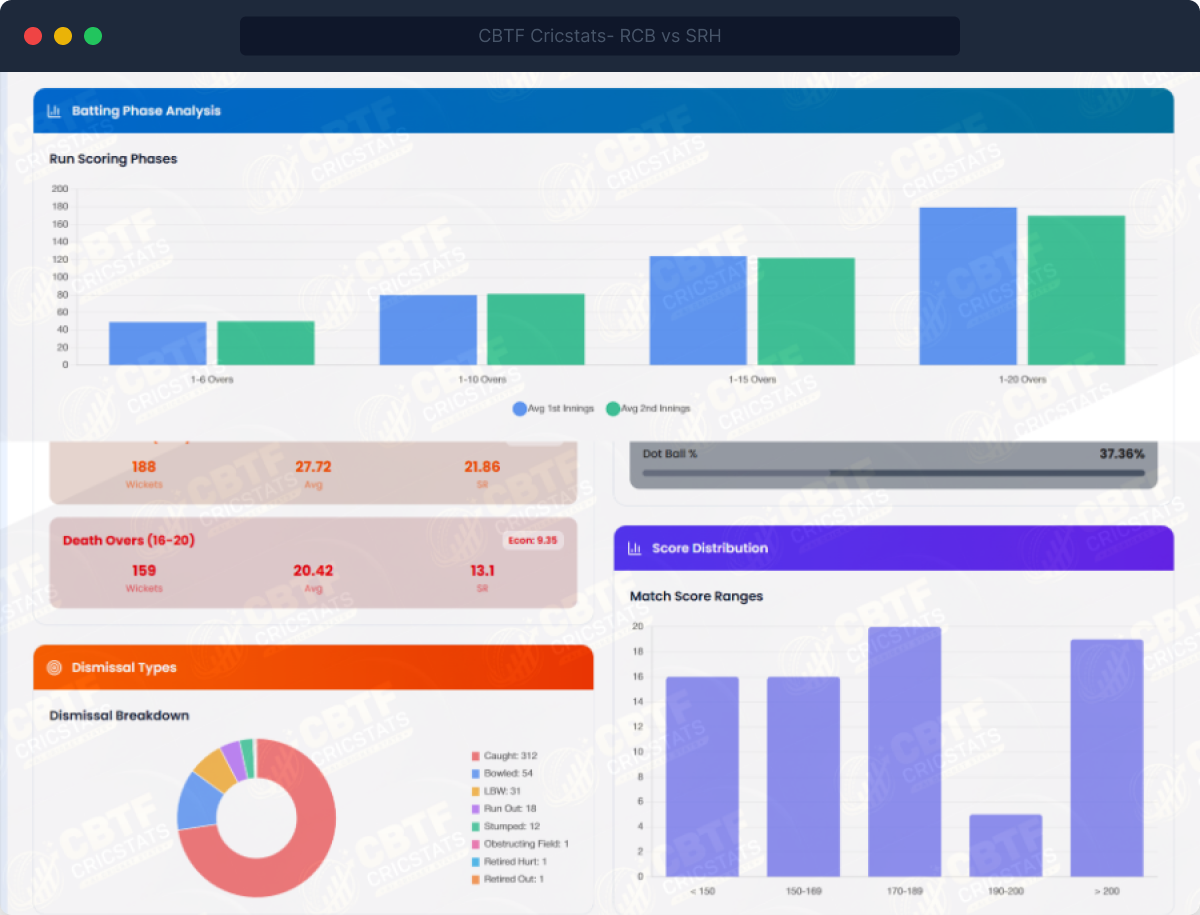
Module 03 · Venue Deep Analysis
The Character of Every Ground, Quantified.
Beyond the averages lies the full analytical portrait of a ground — how scoring patterns evolve over-by-over, where boundaries cluster, how pace and spin compare, how chasing teams perform at different target ranges, and which dismissal types dominate.
- Over-by-over run scoring patterns — 1st and 2nd innings compared on one chart
- Score distribution: how often does this ground produce 160–180, 180–200, 200+ scores?
- Boundary scoring patterns: fours and sixes separately, over-by-over, for both innings
- Phase-wise boundaries: 0–4, 4–6, 6–10, 10–15, 15–20 overs for both innings
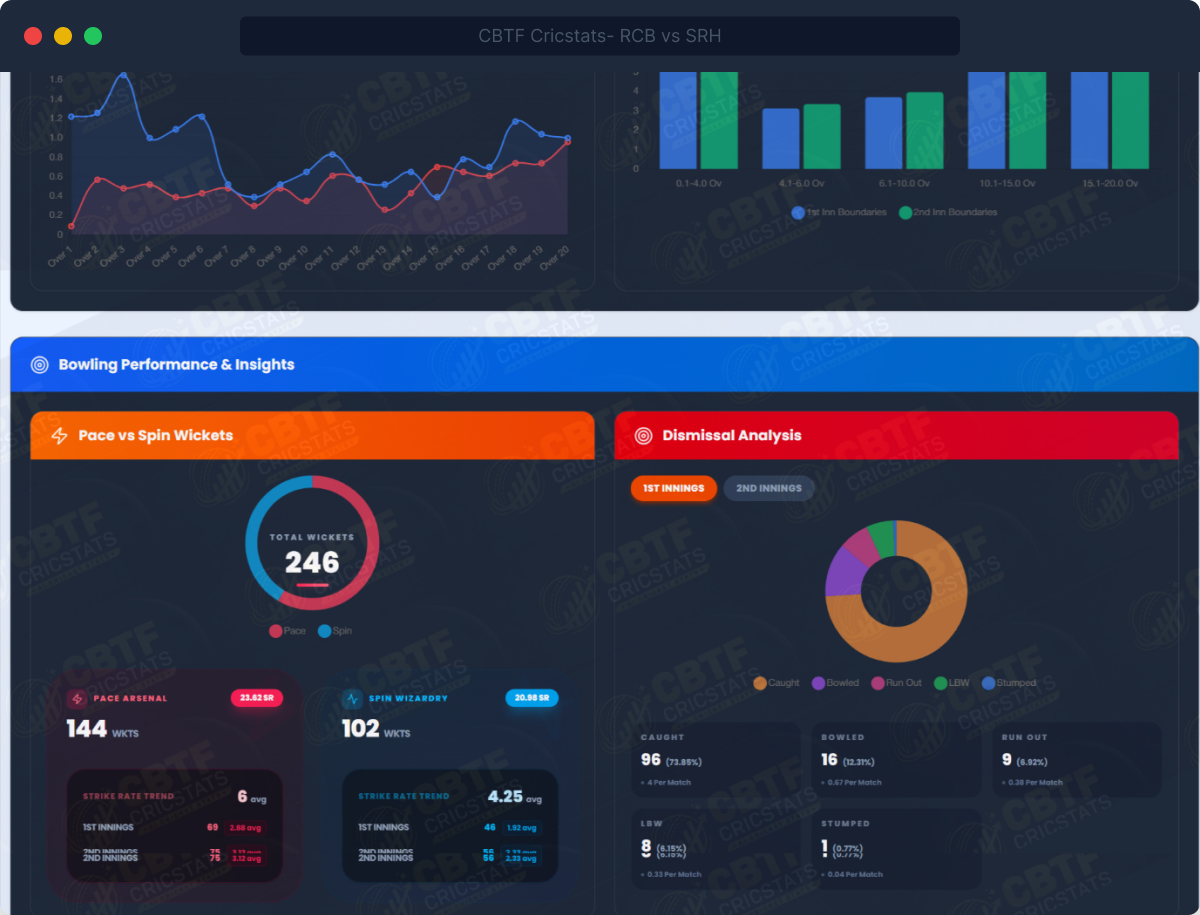
- Pace vs spin: total wickets, economy, strike rate, 1st vs 2nd innings breakdown
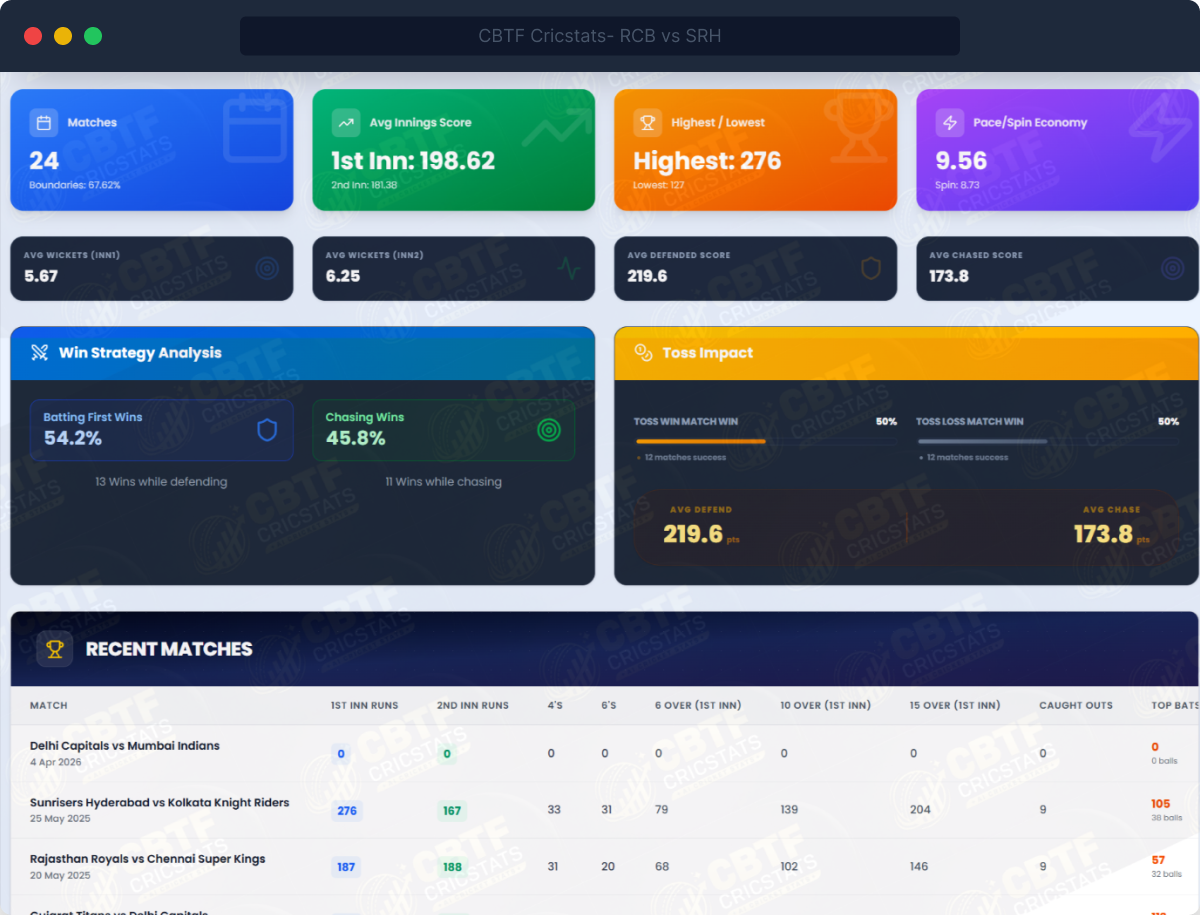
- Chasing vs defending dynamics: success rate by target range (below 140, 140–160, 160–180…)
- Innings phase analysis: avg runs and wickets per phase in both innings
- Top batsmen and top bowlers at this venue — ranked leaderboards
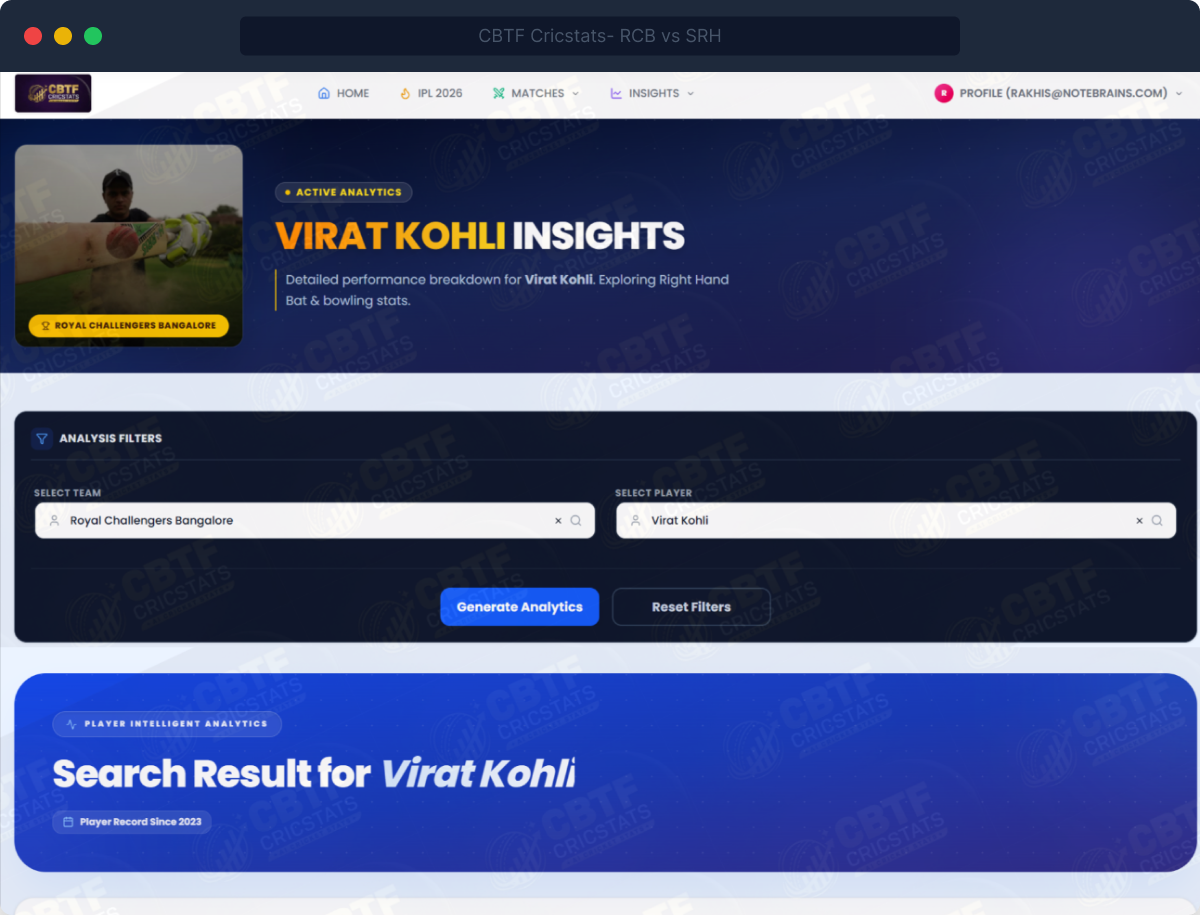
Module 04 · Player Intelligence
A Complete Analytical Biography of Every Player.
Career stats are the wrong tool for today’s decision. CBTF CricStats builds a living, match-by-match profile of every player — updated after every game, segmented by time window, innings type, batting position, venue, and specific opposition.
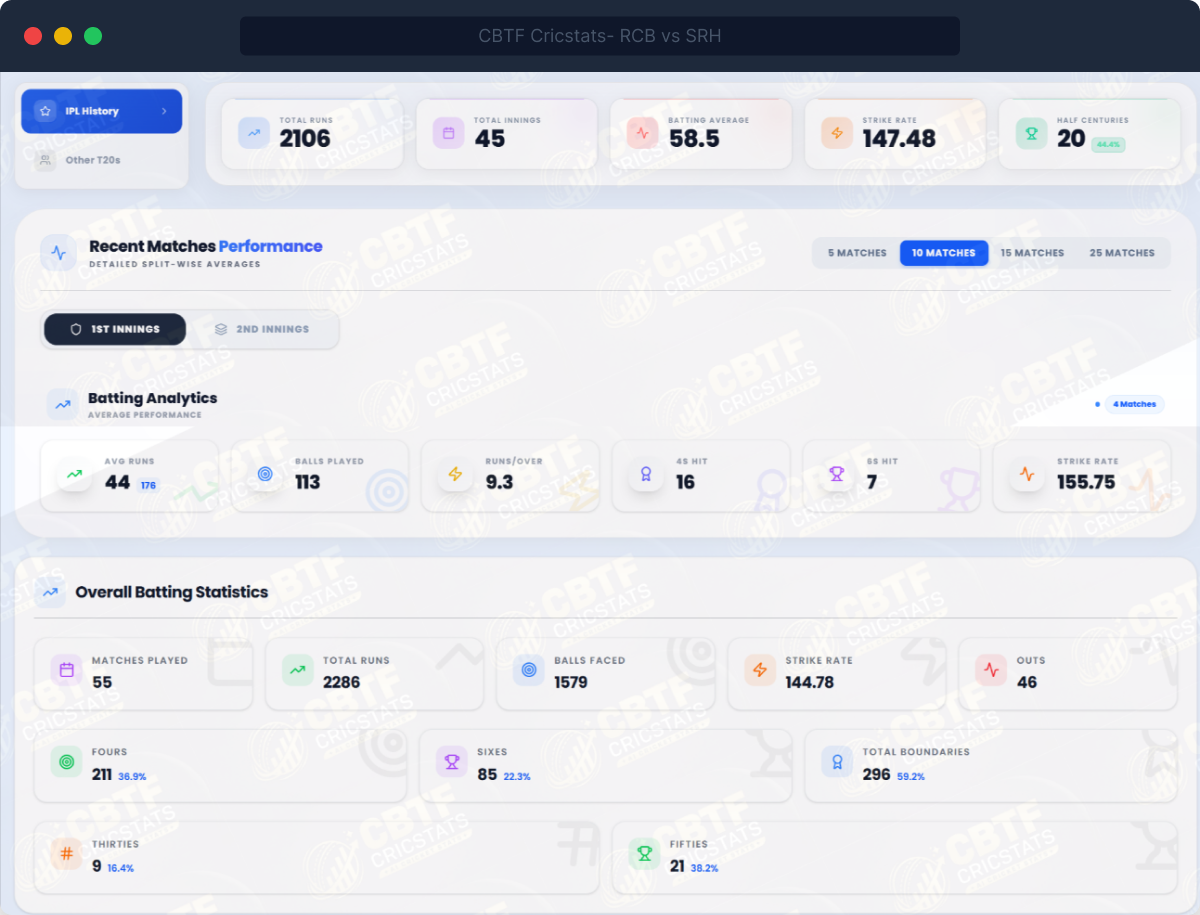
- Recent performance with 5/10/15/25 match toggles and 1st vs 2nd innings split
- AM Average — our proprietary formula delivering true current form across all metrics
- Batting log: every recent match with date, opposition, runs(balls), SR, 4s/6s
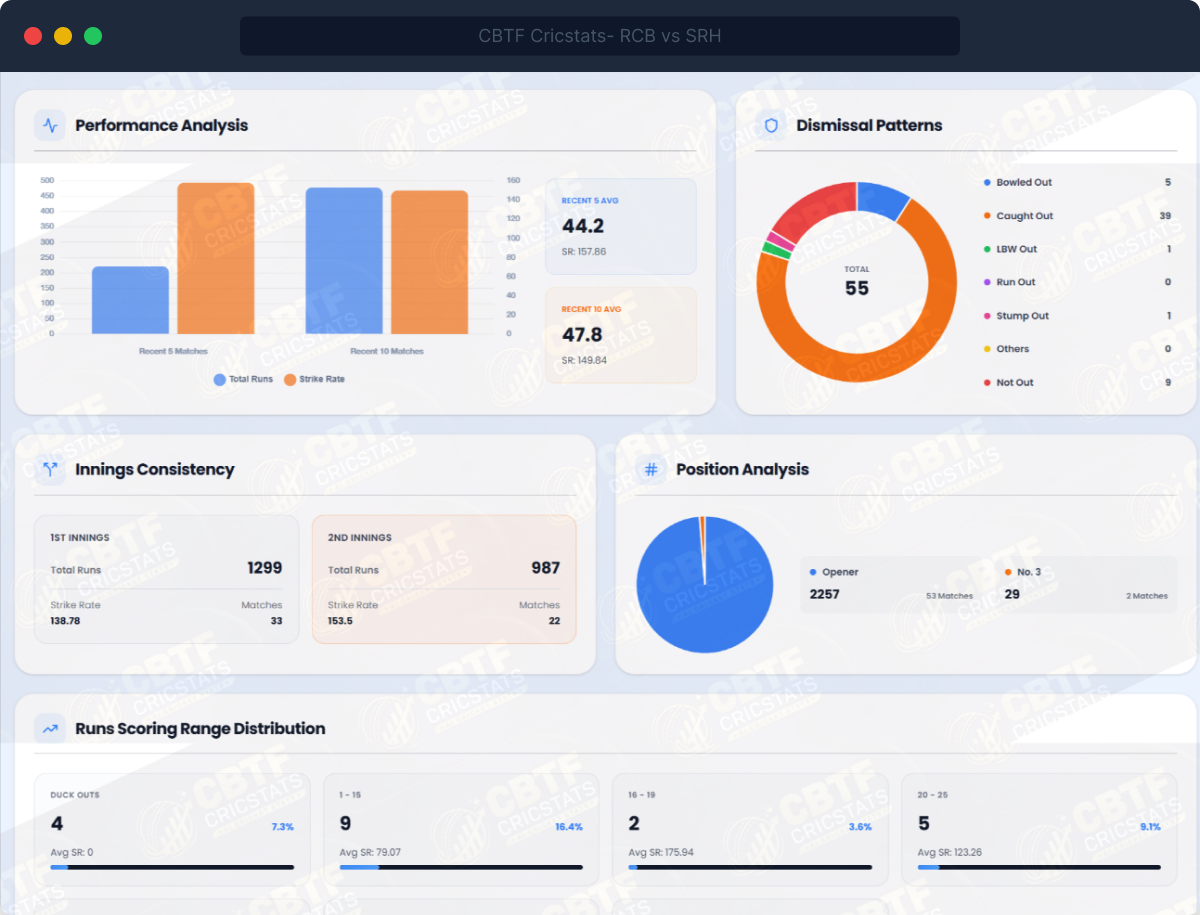
- Performance analysis chart with dismissal patterns donut (every dismissal types tracked)
- Innings consistency: 1st vs 2nd innings runs and strike rate history
- Position analysis: which batting position produces best output for this player
- Runs scoring range: how often this player scores 1–15, 16–19, 20–25… 43+ with avg SR
- Balls faced distribution: average runs when facing 1–11, 12–18, 19–29, 30–45, 45+ balls
- Boundaries distribution: fours range history and sixes range history bar charts
- Venue-wise performance: ranked cards showing avg, SR, milestones at every ground
Module 05 · Proprietary Intelligence
Introducing the AM Average
A career batting average treats a match from 2018 the same as last week. That is the wrong number for a decision you are making today.
The AM Average is CBTF CricStats’ innovative & effective proprietary formula. Built through rigorous backtesting across multiple seasons of ball-by-ball data with advanced AI models, it produces one reliable number reflecting a player’s genuine current form. Named in honour of the mind that inspired and supported its development.
The formula itself is our intellectual property. What it produces — a clean, instantly comparable current-form number — appears on every player card, for both batters and bowlers, across every metric: runs, balls, 4s, 6s, wickets, economy and covers virtually every statistical aspect of a match.
- Covers players: runs, balls faced, boundaries, wickets, economy per time window
- Covers venue stats: avg runs, phase scores, boundaries, and 125+ other aspects
- Multiple windows: Last 25, Last 15, Last 10 — synthesised into one Weighted Average
- Comprehensive coverage: The AM Average due to its dynamic nature caters to almost every aspect of the match
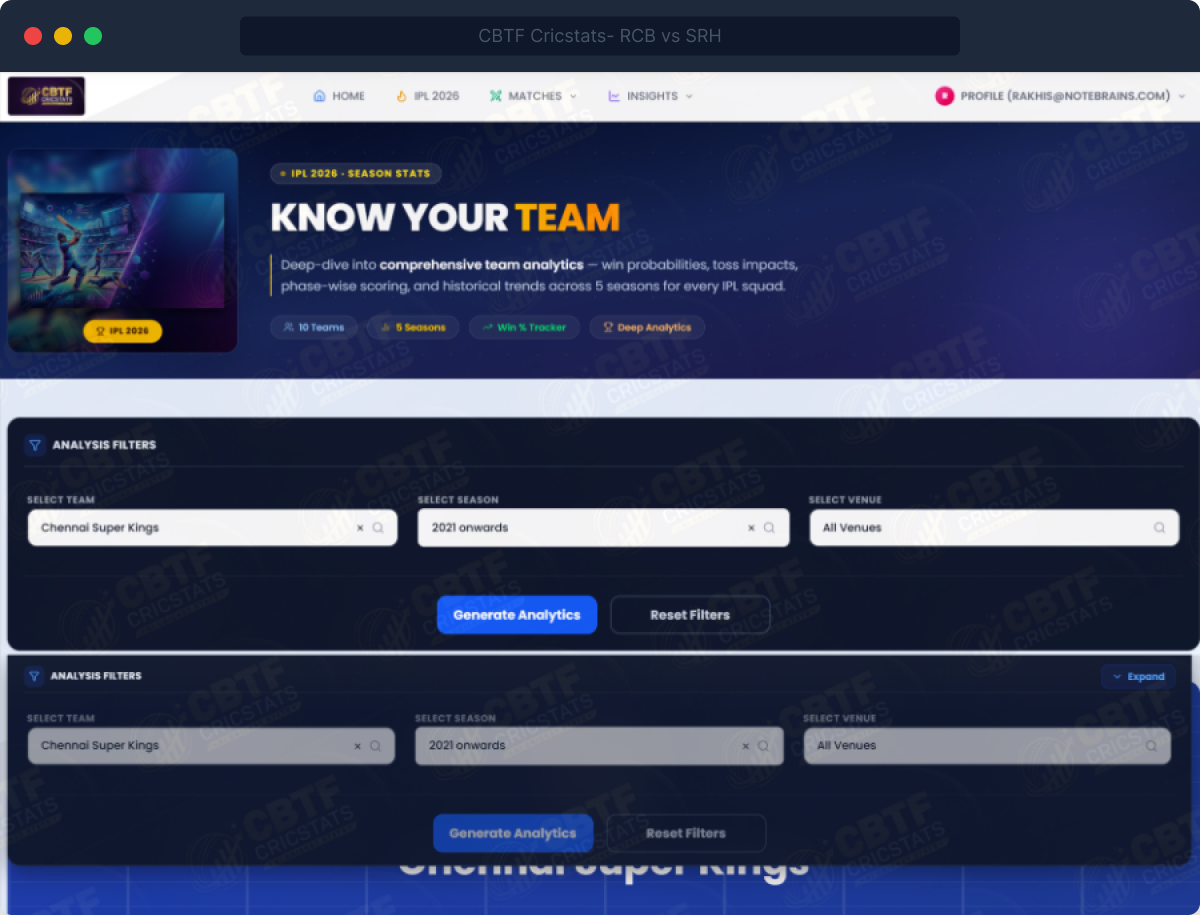
Module 06 · Team Analytics
Complete Team DNA. Every Match Scenario Covered.
CBTF CricStats builds a full analytical profile for every IPL team — how they perform batting first vs chasing, how their run rate changes over-by-over, how their bowling performs in each phase, and how they fare against each specific opposition.
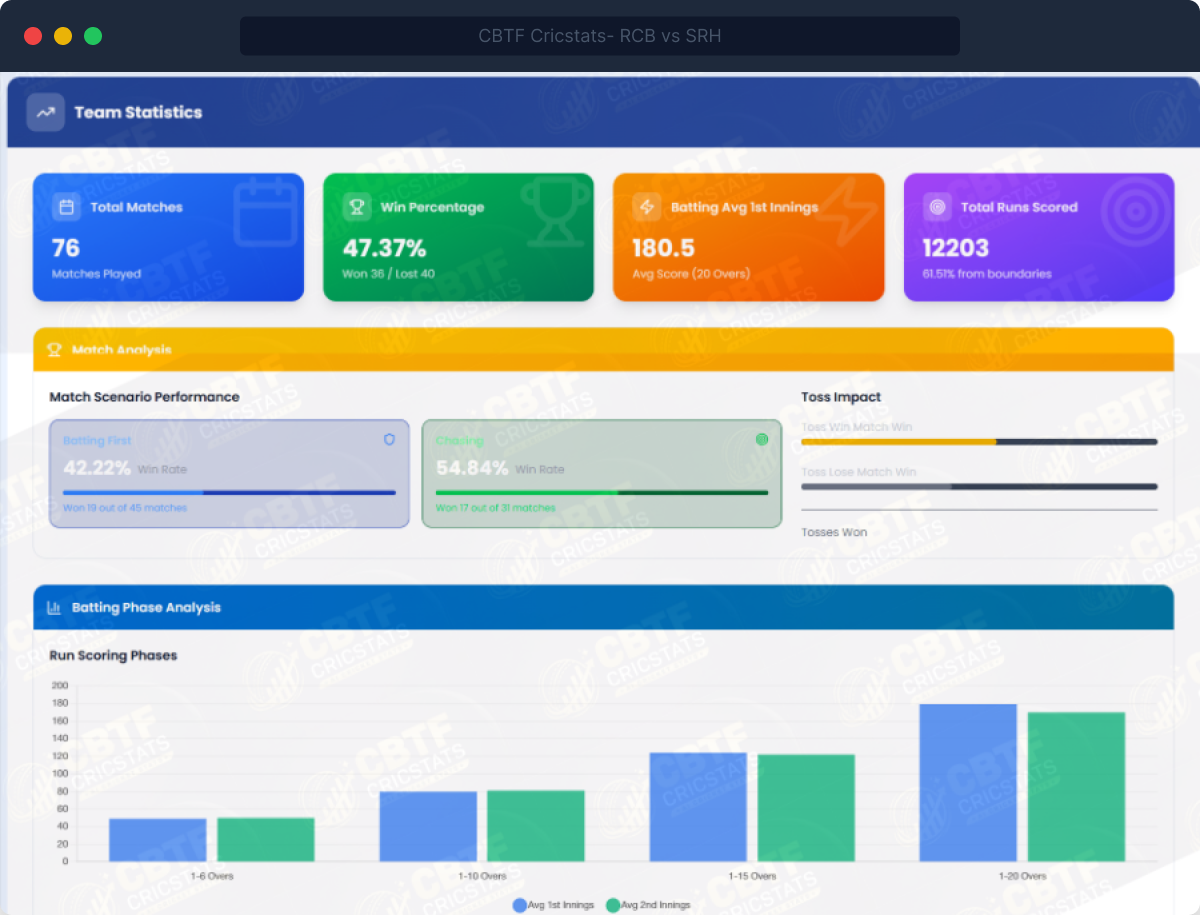
- Team statistics: win%, batting avg 1st innings, total runs, boundary contribution %
- Batting First vs Chasing win rate — so you know their preferred mode of winning
- Toss impact: does winning the toss actually help this team?
- Run rate analysis per over: which overs does this team score most heavily?
- Batting phase chart: cumulative avg at overs 6, 10, 15, 20 for both innings
- Bowling phase analysis: powerplay, middle overs, death — wickets, avg, economy
- Top venues table: win% at every ground they’ve played at
- Performance vs opposition: win record against each specific team they face
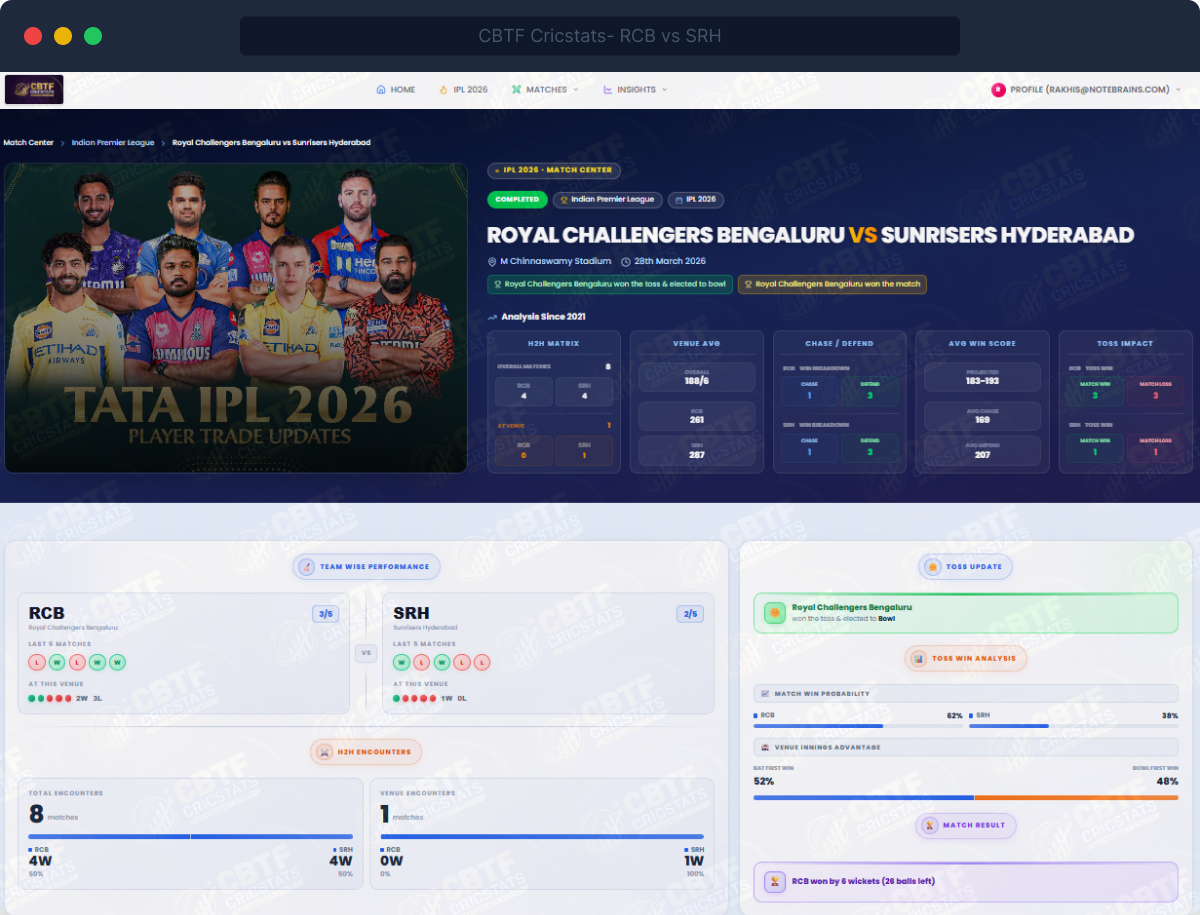
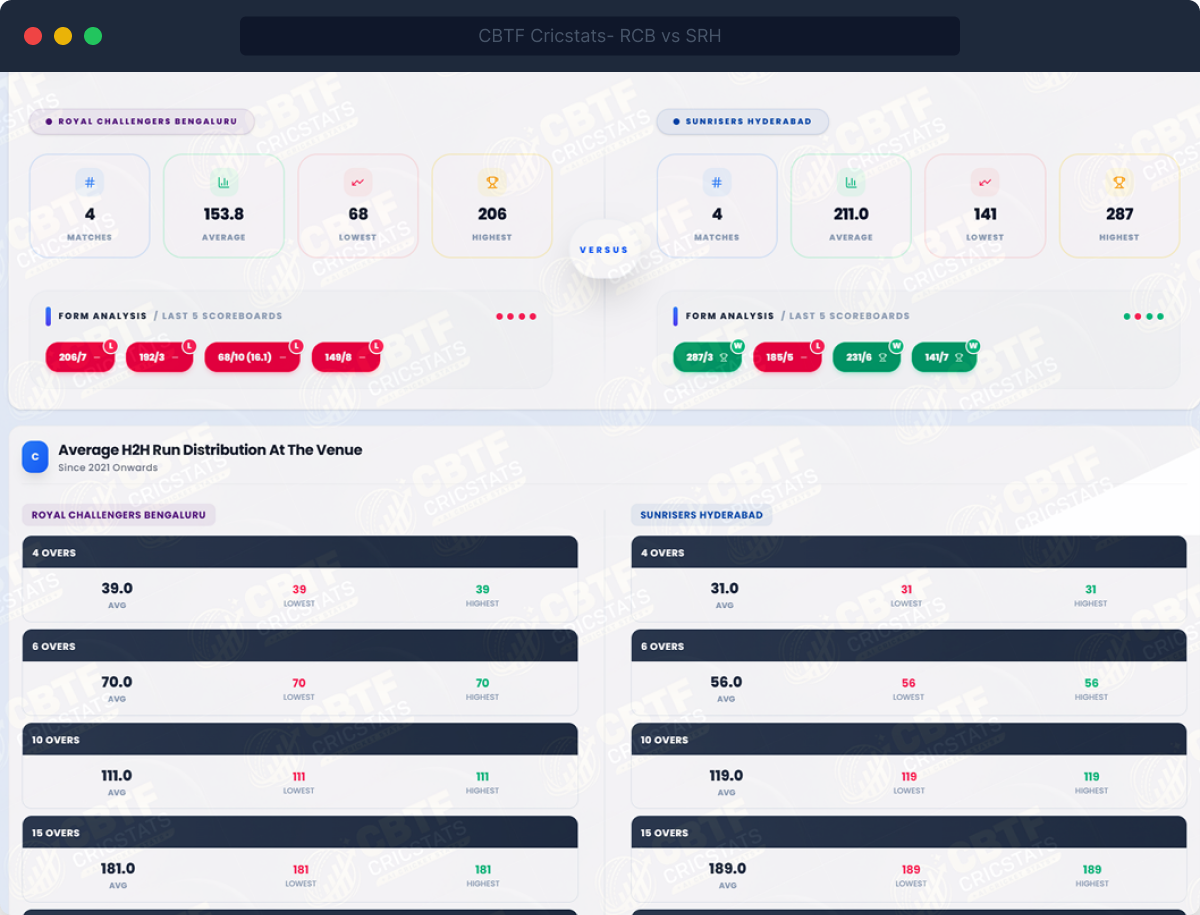
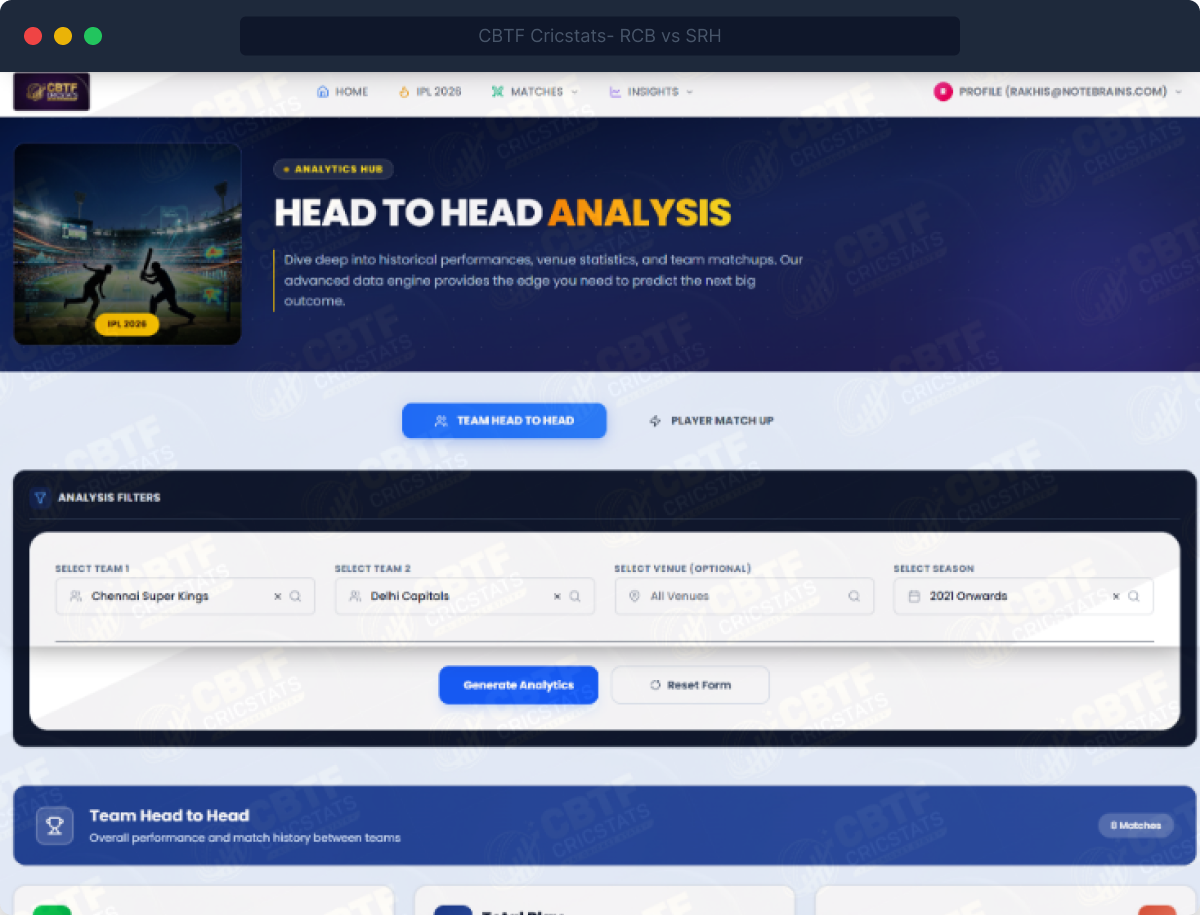
Module 07 · Head-to-Head Analysis
Every Fixture Has a History. Now You Have It All.
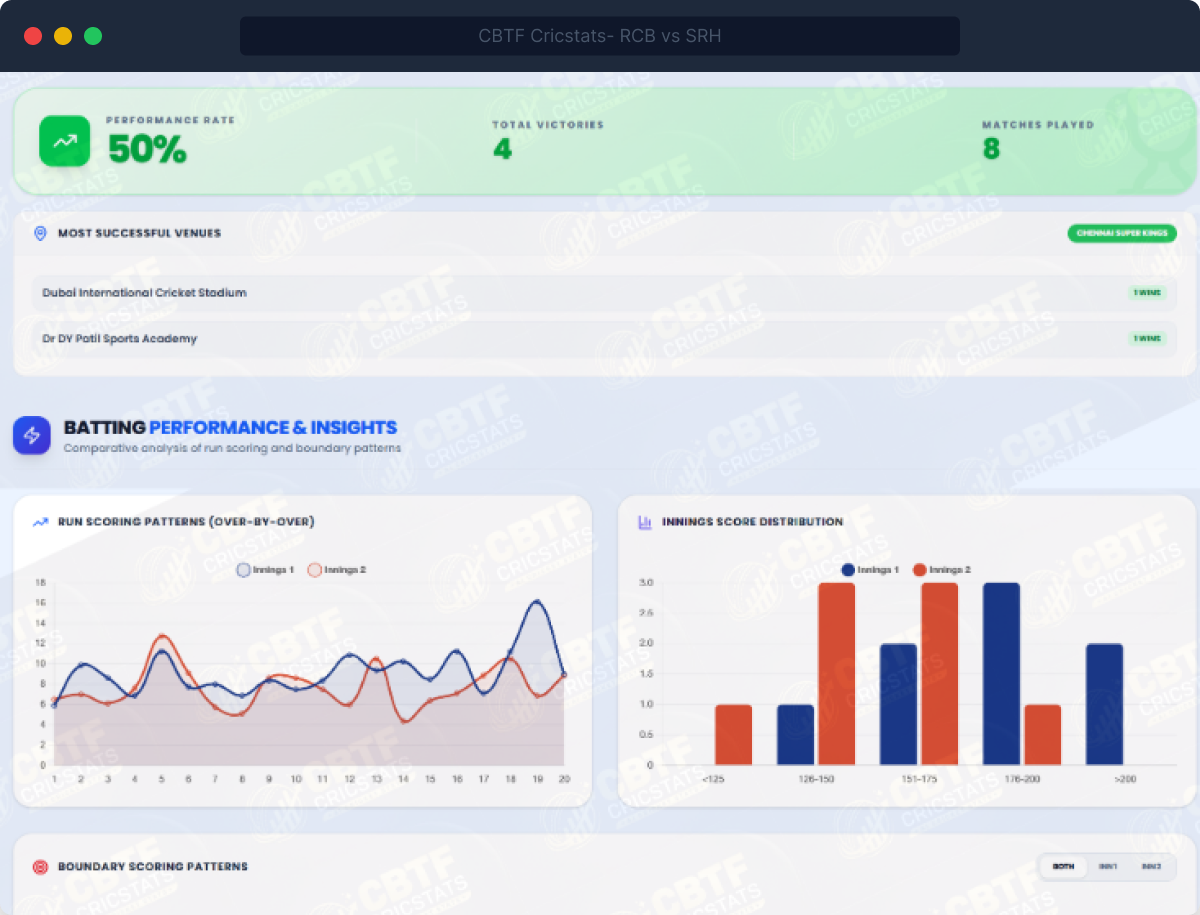
The H2H module is more than a win-loss record. It is a complete analytical portrait of what happens when these two teams meet — how they score over-by-over against each other, which bowler type dominates, where boundaries cluster, and what the dismissal patterns tell you.
- Full battle history: every encounter with date, venue, winner, win type, and scores
- Average H2H run distribution at the venue: each team’s avg, min, max at 4/6/10/20 overs
- Over-by-over run scoring patterns for both teams in this specific fixture
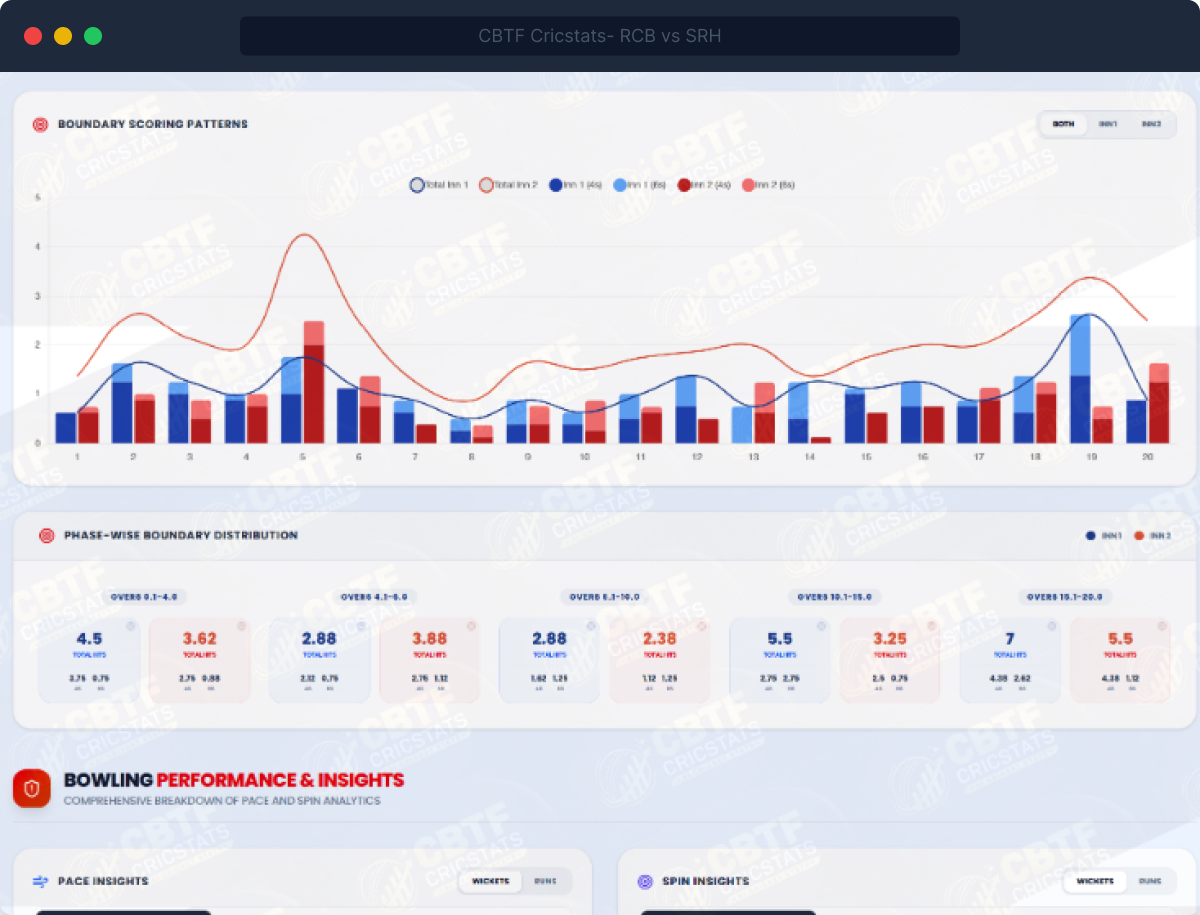
- Boundary scoring patterns: fours and sixes per over, phase-wise breakdown
- Pace Insights: total wickets, avg/match, dominant bowler type, RHB vs LHB victims
- Spin Insights: same structure — who does this fixture hurt more in spin bowling?
- Dismissal types breakdown with donut chart and per-match frequency
- Phase-wise wickets: where do wickets fall in this specific fixture?
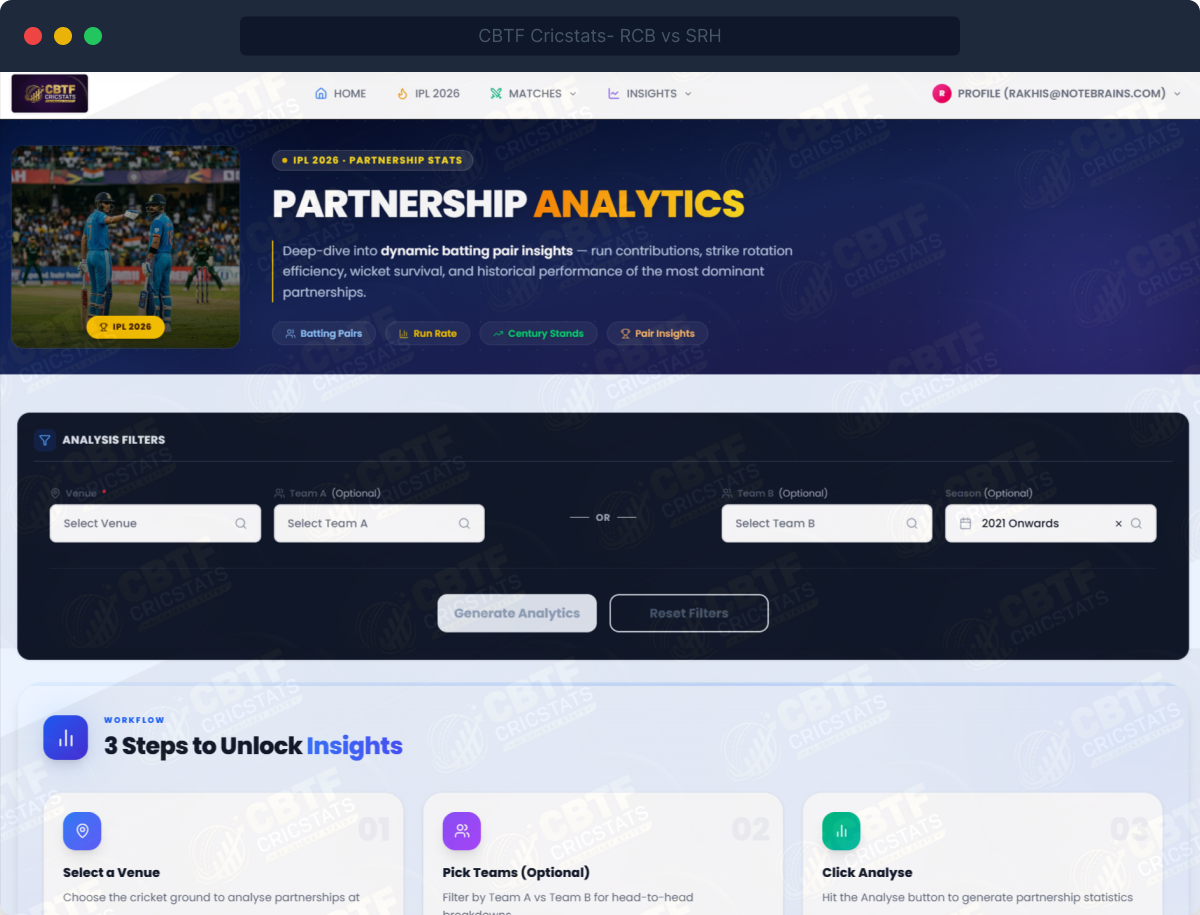
Module 08 · Partnership Analytics
Know What Every Wicket Position Typically Produces.
Partnerships are the unit of T20 innings — not just individual scores. Our Partnership module shows the average stand at every wicket position (1st through 10th) across multiple matches, with a drill-down into the run range distribution and the actual top partnerships with player names, contributions, and dates.
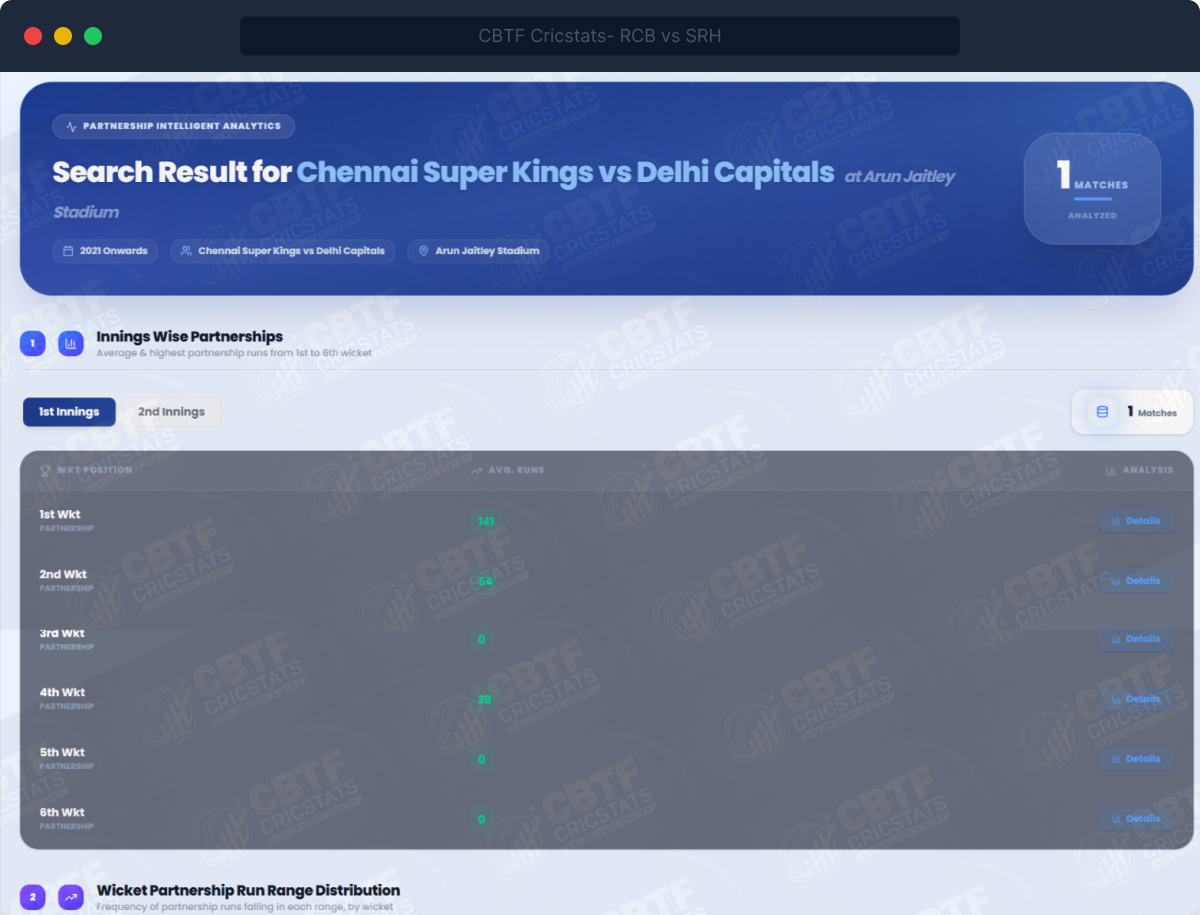
- Average partnership runs at every wicket position — 1st through 10th
- 1st innings vs 2nd innings split with separate toggle
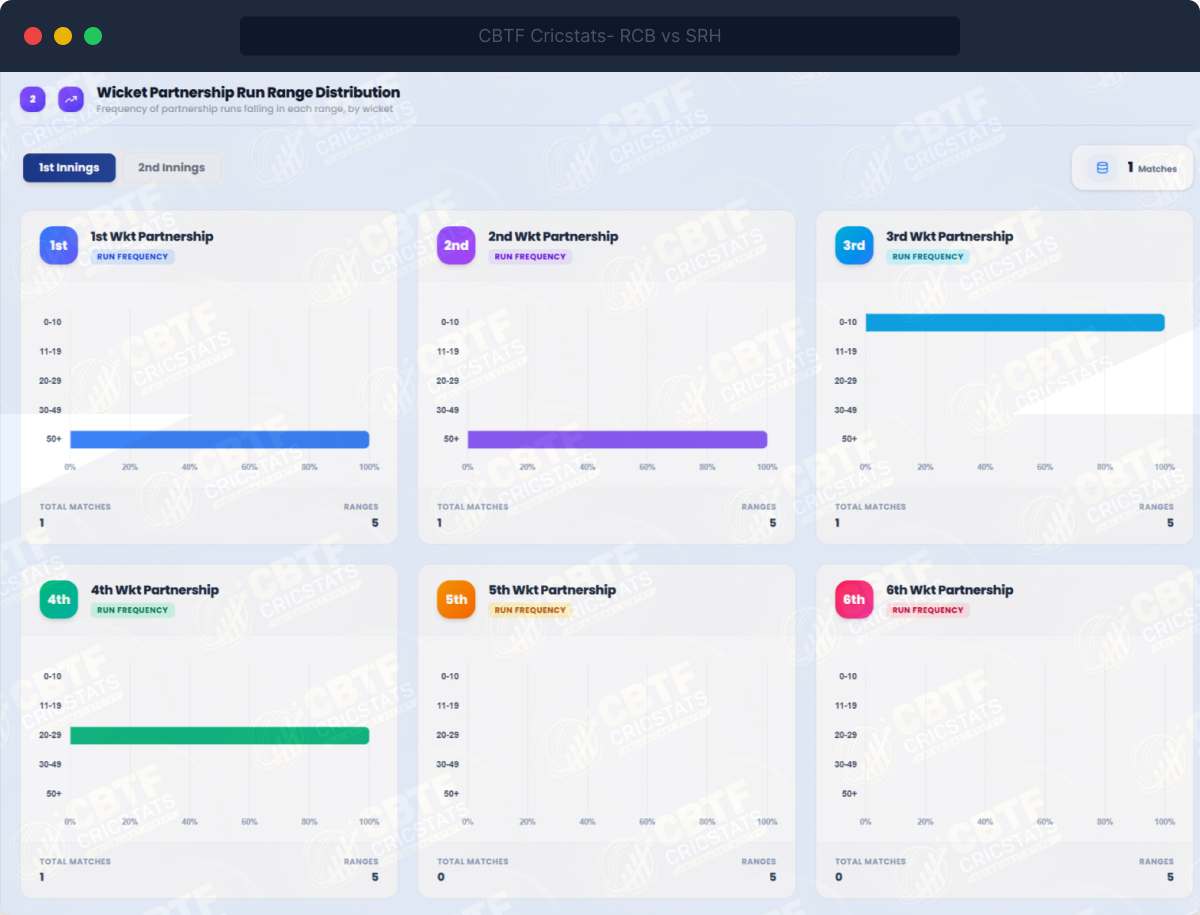
- Drill-down per wicket: run range distribution (0–10, 11–19, 20–29, 30–49, 50+)
- Top partnerships list: runs, team, both player names with individual contributions
- Highest partnership ever for that wicket position at this venue
- Total 50+ partnerships per match — how often do big stands occur here?
Module 09 · Session Intelligence
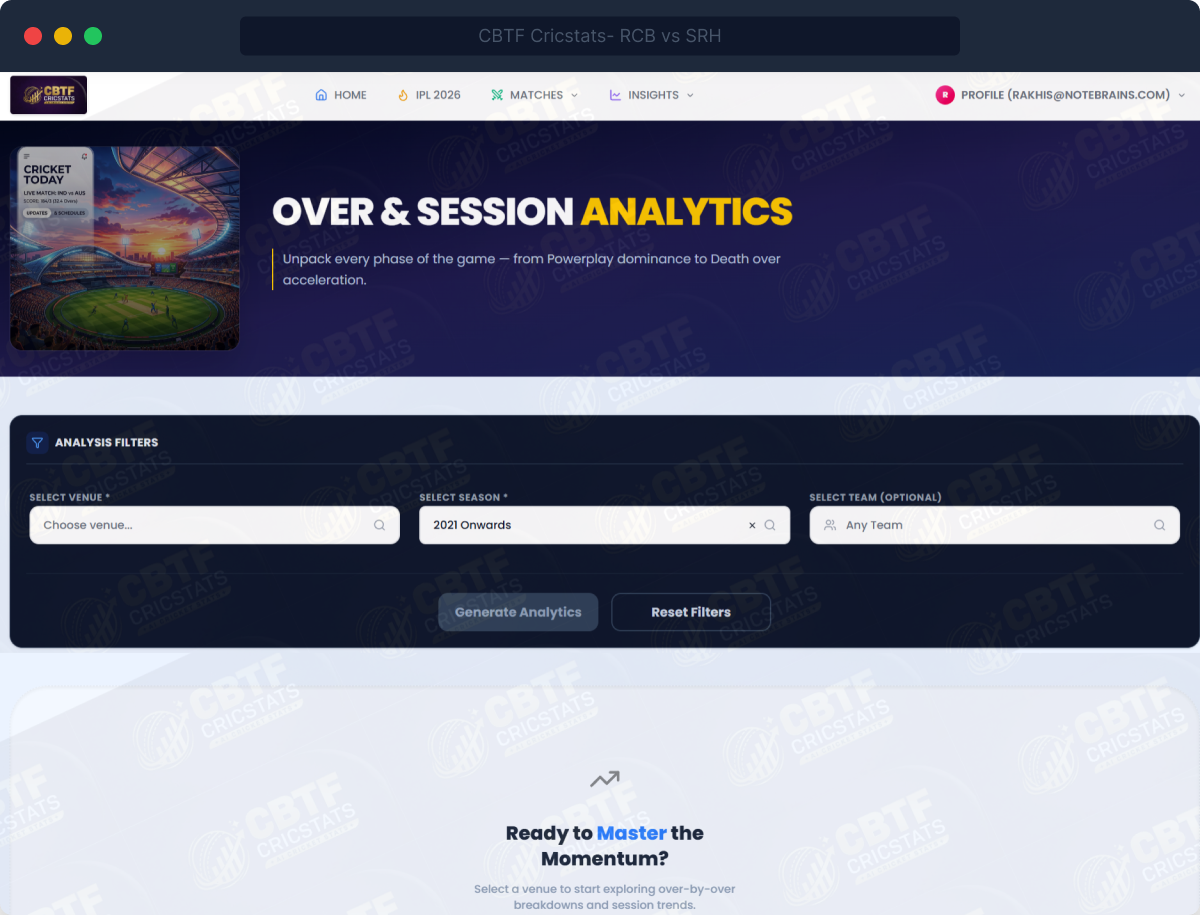
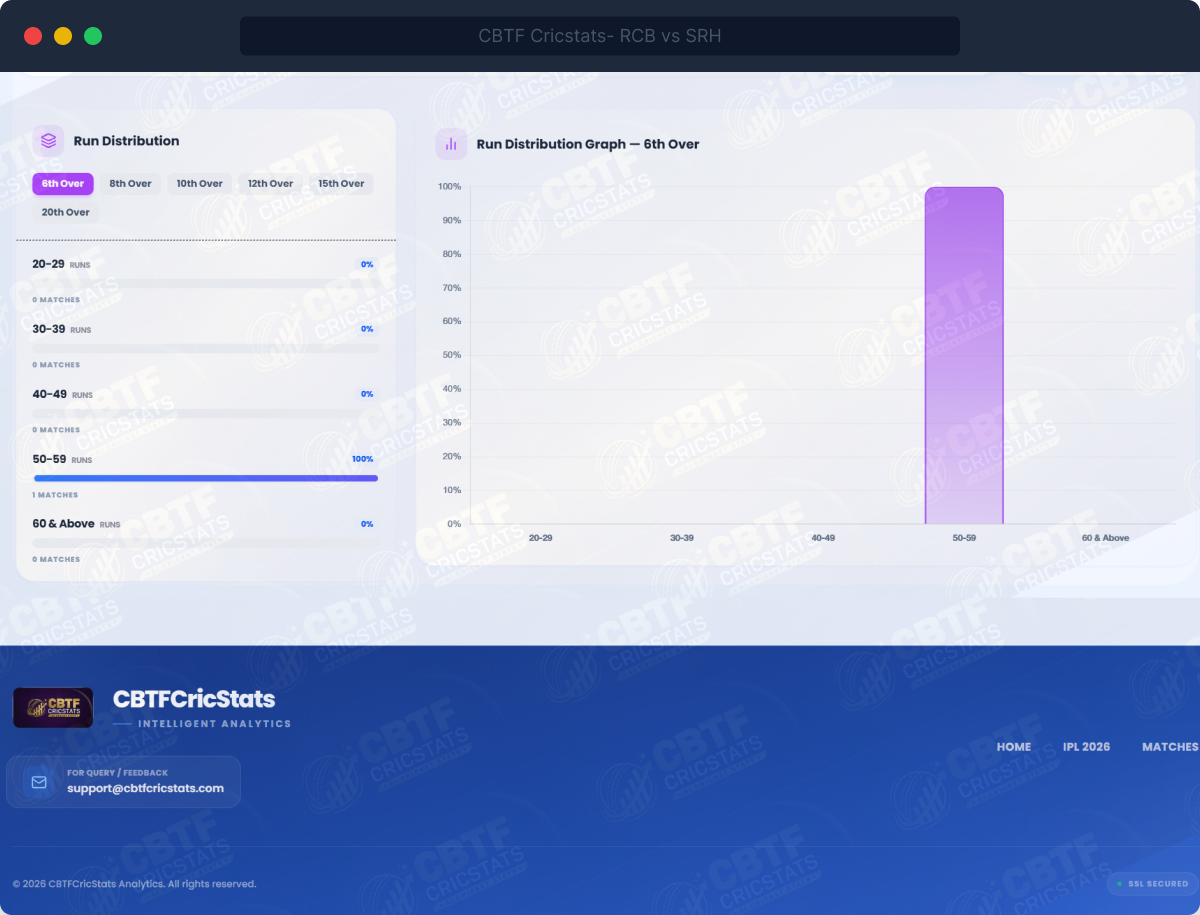
Par at Every Over. Context at Every Moment.
The Session module answers the single most important in-match question: is this innings on track? We give you the cumulative average score at every over from 1 to 20, plus a detailed run range distribution at each key milestone over.
When a team is 68/2 after 10 overs and the 10-over average here is 84, you know — instantly, without calculation — that they are 16 runs behind par. That is the decision-support capability this module delivers.
- Average cumulative runs over-by-over (1–20) as both a bar chart and a line
- Key over benchmarks: 6th, 8th, 10th, 12th, 15th, 20th overs highlighted with exact averages
- Run distribution graph per key over: what % of matches scored 30–39, 40–49, 50–59, 60+ at Over 6?
- Selectable over filter: click any of 6th, 8th, 10th, 12th, 15th, 20th for its distribution
- 1st innings vs 2nd innings toggle throughout
Module 10 · Fixtures
The Full Season. At a Glance. Always Current.
Every fixture across the current season — date, time, venue, teams, and competition stage — loaded in one clean view. Not a static list that goes stale. A live schedule that links directly into the full analytical stack for each match, so the moment a fixture is confirmed, your prep can begin.
- Full season fixture list — every match with date, time, and venue displayed
- One-click entry into the Match Center, Venue Stats, and H2H engine for any fixture
- Live match status indicator — upcoming, in-progress, or completed
- Filterable by team, venue, or match stage across the full season calendar
Module 11 · Results & Scorecards
Every Match. Full Scorecard. Every Number That Mattered.
A complete record of every completed match in the across seasons — not a summary, a full innings-level breakdown. Both batting and bowling scorecards side by side, top performers surfaced instantly, and the match result in full context. The data you need to understand what happened before you analyse what will happen next.
- Full batting scorecard per innings — runs, balls, SR, 4s, 6s, dismissal type and bowler
- Full bowling scorecard per innings — overs, maidens, runs, wickets, economy, extras
- Top performers highlighted — highest scorer, highest SR, leading wicket-taker per match
- Fall of wickets sequence — when each wicket fell and at what score
- Filterable by team or venue across all completed season matches
Module 12 · Player matchups
Batsman vs Bowler. The Head-to-Head That Actually Decides Matches.
The most underused edge in cricket analytics is also the most specific: how does this batter perform against this exact bowler? The Player Matchup module gives you the full head-to-head record for any batter-bowler combination — balls faced, runs scored, dismissals, SR, and economy — filterable by phase, venue, and innings type. Not career numbers. Not team-level tendencies. The individual duel, quantified.
- Select any batter and any bowler for a direct H2H breakdown across all recorded encounters
- Balls faced, runs scored, dismissal count, batting SR, and bowler economy per matchup
- Dismissal breakdown — caught, bowled, LBW, stumped, with bowler type annotation
- Innings type split — does the batter perform differently against this bowler batting first vs chasing?

Make Infromed Decisions - Backed by Irrefutable Data
Stop Guessing. Start Using Stats backed by Solid Evidence
The deepest cricket intelligence platform ever built. Every stat that matters. Nothing that doesn't. All correlated. One click.
8+ Intelligence Sections
Every Angle of Cricket. One Platform.


From Our Community
From Our Community
Subscription Plans
Every Level of Cricket Intelligence.

- Match Center overview
- Basic venue averages
- H2H win records
- AM Average player cards
- Venue Fancy Stats + session/partnership + team analytics

- All 8 modules — full access
- AM Average™ across 10/15/25 windows
- Venue Fancy Stats — all 100+ metrics with drill-down
- Venue deep analytics — charts, pace/spin, dismissals
- Full H2H engine since 2021 + sessions + partnerships + team analytics + player vs player

- Everything in Pro Analyst
- All leagues — PSL, T20 WC, BBL, ILT20
- Data API access for developers
- Priority Telegram intelligence alerts
- Custom watchlists + onboarding + early access to new modules